I first got in contact with the Assistant Professorship of Environmental Sensing and Modeling at the Science Hack 2019.
For the past semester (WS20) I've been doing a research internship at this chair.
I will soon start writing my bachelor thesis here.
🥷 Science Hack 2019
This hackathon was organized by the TUM Junge Akademie and took place in December 2019. Also see: https://www.ja.tum.de/sciencehack-2019/
The challenge our team was assigned to was proposed by the ESM Chair: Visualize Green-House-Gases from the EDGAR and ODIAC dataset. EDGAR and ODIAC are public GHG inventories containing concentrations of CO2, CH4 and a lot of other gases.
A commonly used tool for analyzing geospatial datasets is Panoply. However, when you want to share specific insights on your measurement results it is quite inconvenient to send someone the raw dataset alongside instructions on how to install Panoply and how to open/locate the map sector you want to share.
Sidenote: Installing Panoply on MacOS Big Sur has become really hard since it requires a specific Java version that can only be installed by using some workarounds.
Our idea: What if you could just distribute/embed your visualization with a url for the exact scenario you want to target? This is why we chose a web app for this task. No installation required and compatible with any modern browser. ✨
You can find a few impressions of our submitted tool below.
The repository can be found here: https://github.com/dostuffthatmatters/ScienceHack2019 Be aware: This is a hackathon project - a quick prototype of how our idea might look like.
The current version calculates the render-scenes from the raw .nc files that EDGAR/ODIAC publishes. Therefore the queries (especially large ones) are really slow. In a real product we would of course heavily use preprocessing.
A working live version: https://science-hack-2019.herokuapp.com/ This live version is using free VM's which take ~20 seconds to start up
🔬 Research Internship
From November 2020 until January 2021 I've been doing a research internship at the ESM chair.
I mainly worked on two things: The inversion framework and a visualization of semi-live MUCCNET data.
My Work on the Inversion framework
The inversion framework is a tool for backtracking emissions.
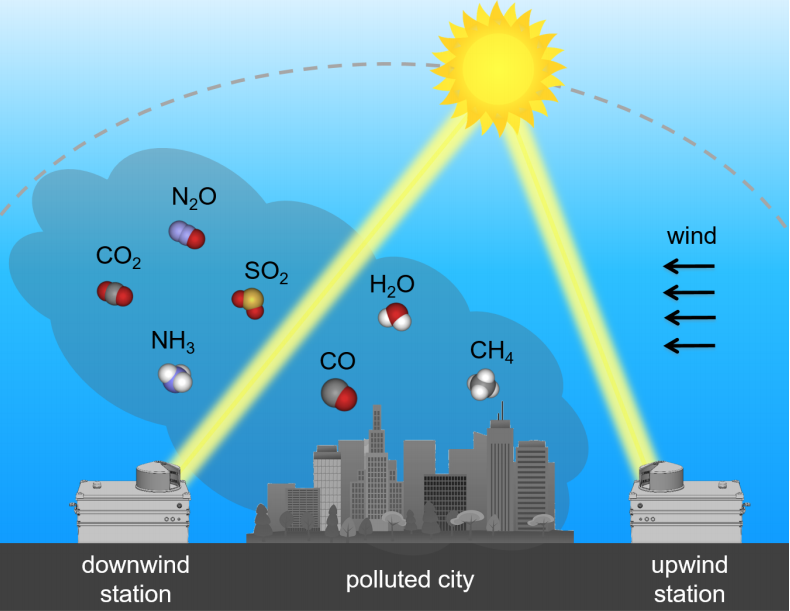
Using a few Total Column Measurement ground stations one can measure the CO2/CH4 concentration that "flows through an atmospheric column" at a certain location. The inversion framework can combine this data with information about wind speeds/directions in order to compute an emission map between those ground stations - "Where did these emissions come from with prior knowledge about concentration-timeseries at the ground stations?"
Records of CO2/CH4 emissions already exist - calculated with a bottom-up-principle: "How much does this factory emit in theory?". These records are called emission-inventories. EDGAR and ODIAC mentioned before are inventories and CAMS is another one.
The goal of the inversion framework is not to calculate a map of absolute emission values but how much the actual values differ from the inventory - the "enhancement". It is a top-down approach: "How much emissions do we actually measure right next to the factory?", "How much does this differ from the official records?"
My task was to analyze the CAMS inventory in order to possibly use it as the background-prior in the inversion framework.
The inversion framework can be really useful for detecting large unknown emitters.
One example is the gas pipeline-network spanning below the city of Indianapolis. The whole network is rather old and has many leaks. Renewing the whole network at once is close to impossible but eliminating just the major leaks is a very effective mechanism for reducing GHG emissions. Determining the locations of those leaks could be done with the inversion framework.
Using a few stations around the city is way more cost effective than monitoring the whole city with on-site measurements next to every possible leak.
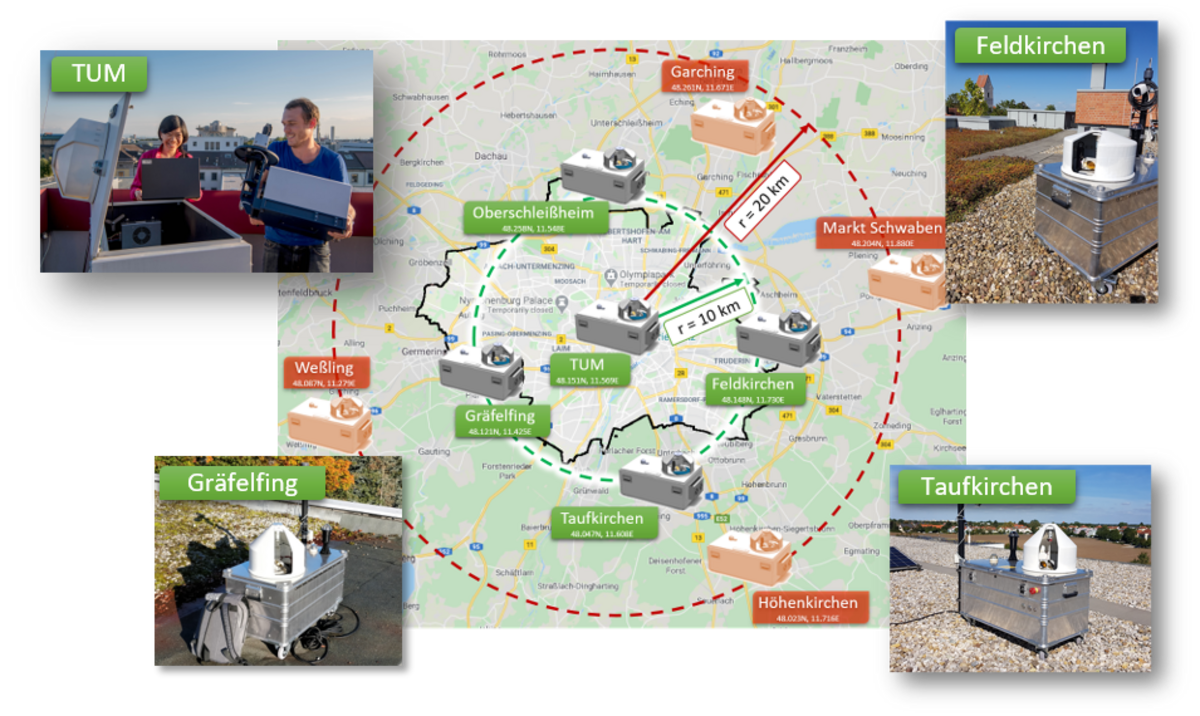
Visualizing MUCCnet data
The other part of my research internship was to visualize data produced by the MUCCnet depicted above.
You can find the live version here: https://esm-plots.dostuffthatmatters.dev/em27/
I used Gatsby, TailwindCSS, D3 and FaunaDB to build it. The site is statically hosted, the database queries are cached. The data can be updated by the ESM team with a simpel script. Updating the data does not require re-rendering the page.
The plot is used as an embedded iFrame here: https://atmosphere.ei.tum.de/ I did not want to embed a D3 plot and custom logic into a WordPress site 😅
Some of the more recent work
Since I work far more at the department than I spend time to 'blog' about the work, these are just some highlighting insights:
- Sensor Footprints: https://esm-plots.dostuffthatmatters.dev/muccnet-map/ (Also used on https://atmosphere.ei.tum.de/)
- CH4 Emission Map: https://esm-plots.dostuffthatmatters.dev/inventory/ (Will also be used on the atmosphere page)
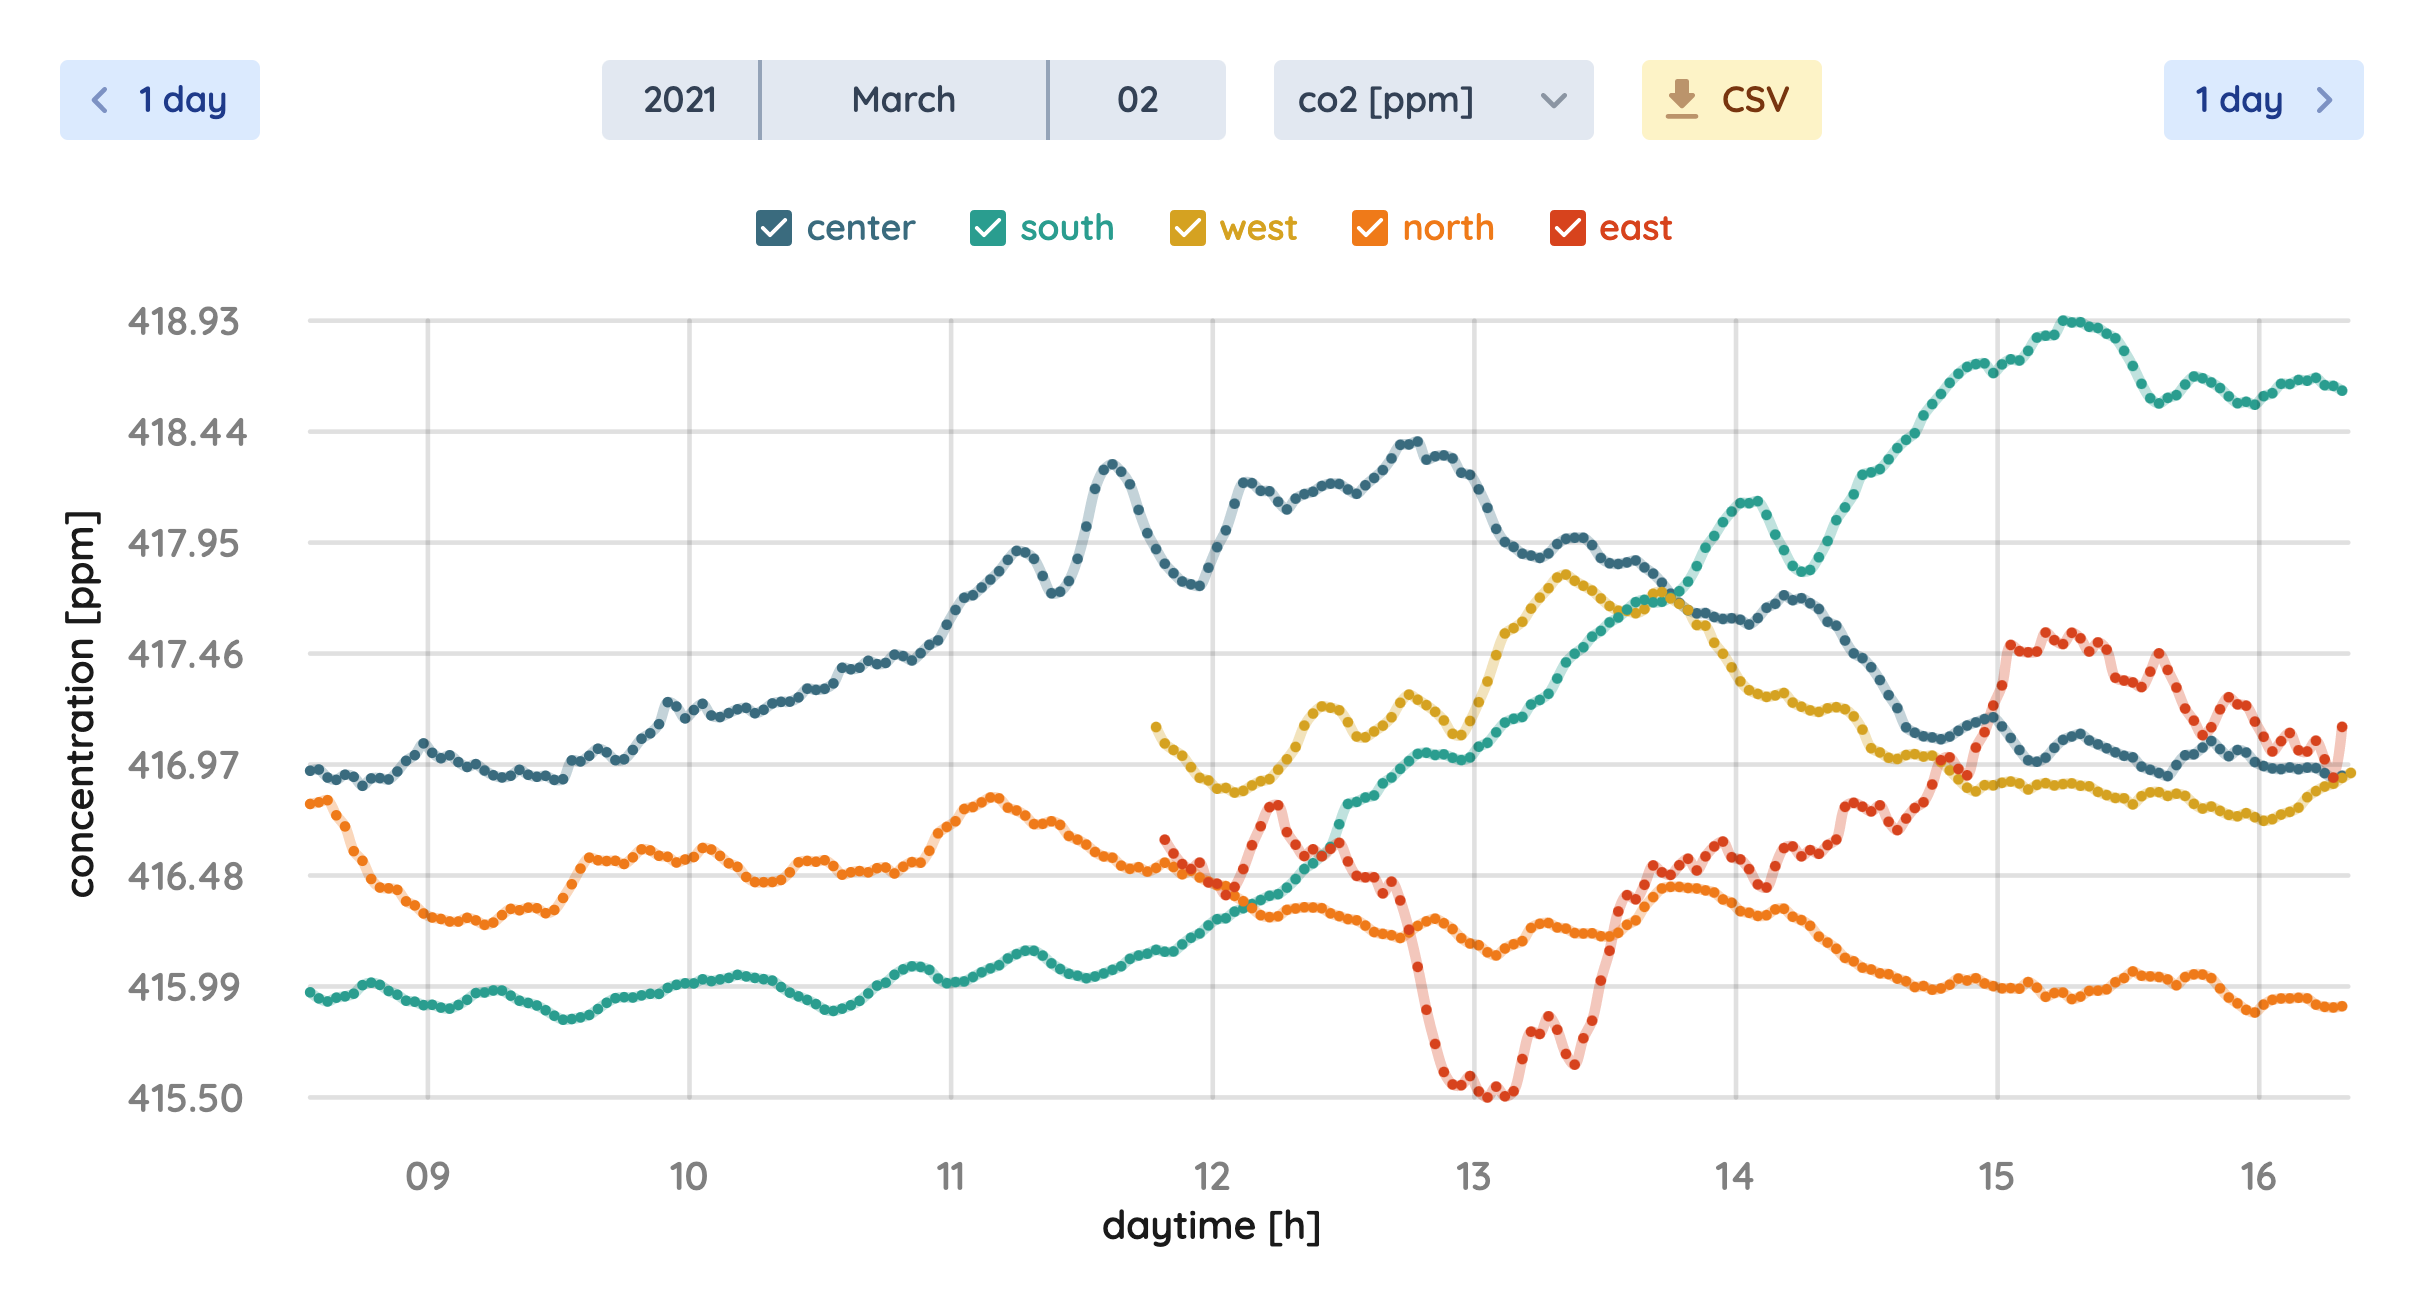
Furthermore, I implemented a database with real-time functionality, i.e. web-sockets notifying clients on table inserts. In sync with that I built a table-plot displaying this data.
Later I added a color-rating on those concentration values.
It fascinates me every time, how small changes can drastically improve the appearance of a website: Initial color-table vs. improved color-table.
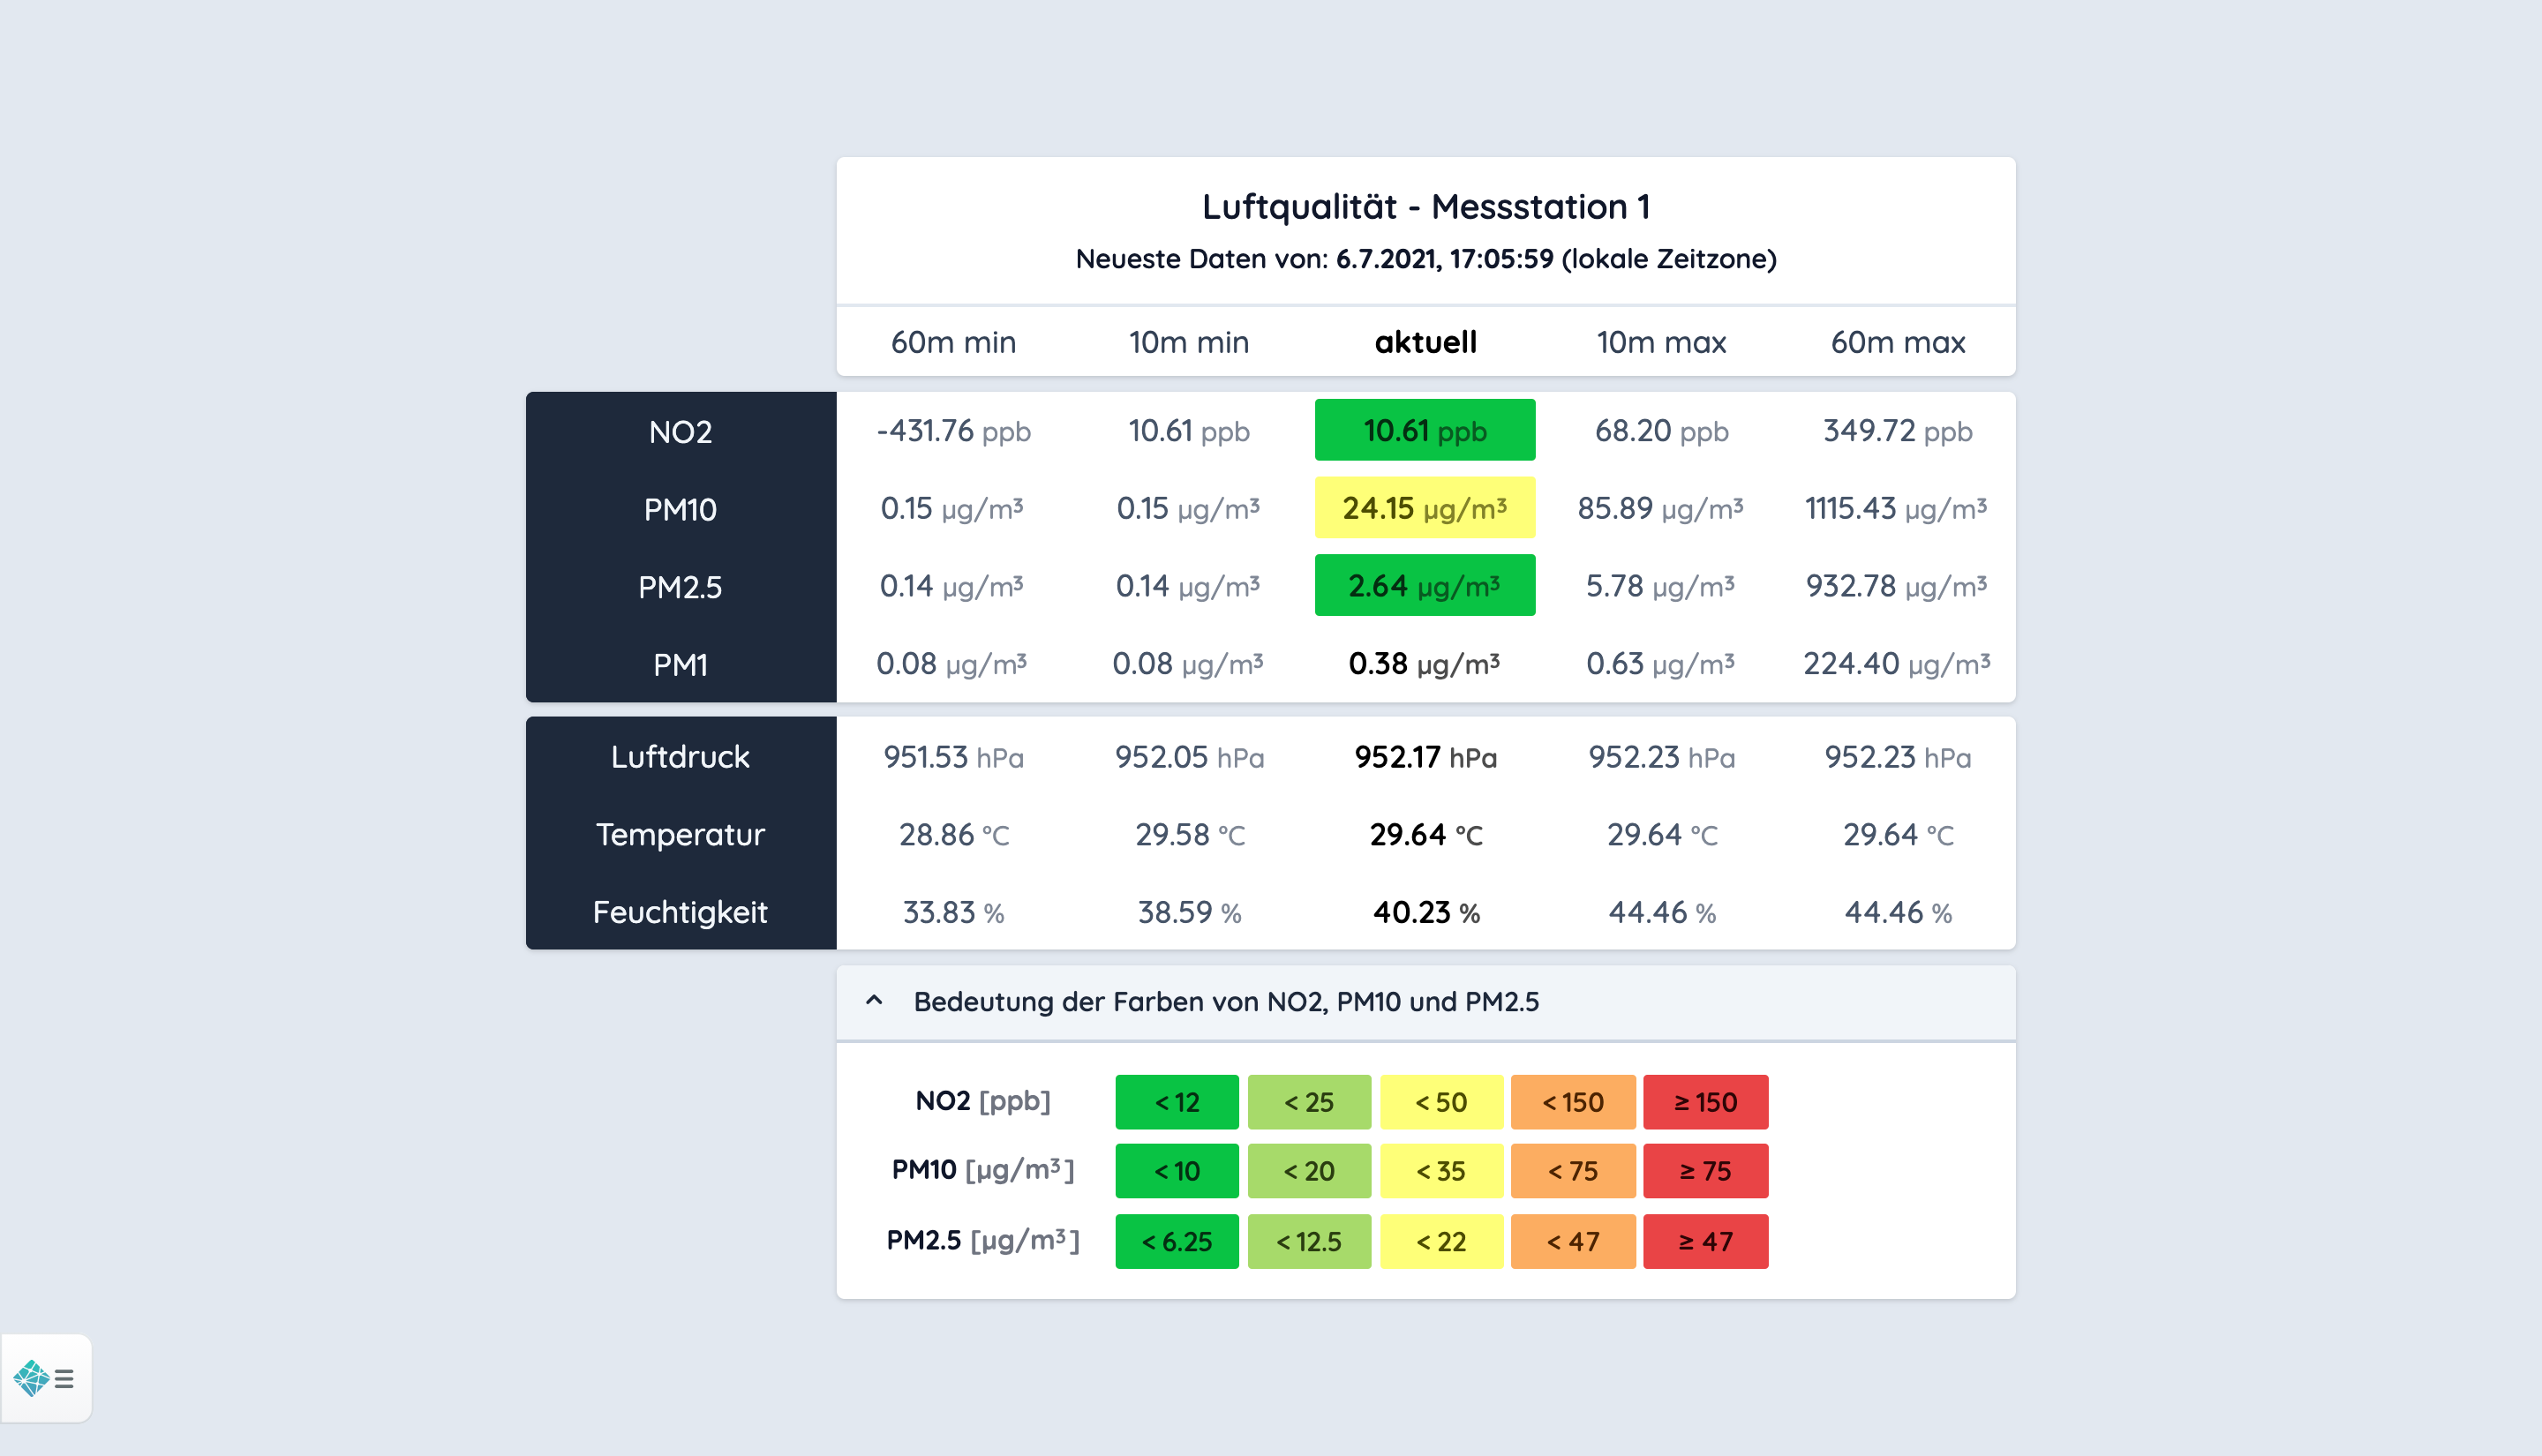

The first row contains negative values, because I took these screenshots during a test run and the measurement station produced wrong values.
🎓 Bachelor Thesis
Details coming soon ...